Puck it
Well-known member
Some fodder for a sleepy Monday.


Welcome to AlpineZone, the largest online community of skiers and snowboarders in the Northeast!
You may have to REGISTER before you can post. Registering is FREE, gets rid of the majority of advertisements, and lets you participate in giveaways and other AlpineZone events!


Some fodder for a sleepy Monday.
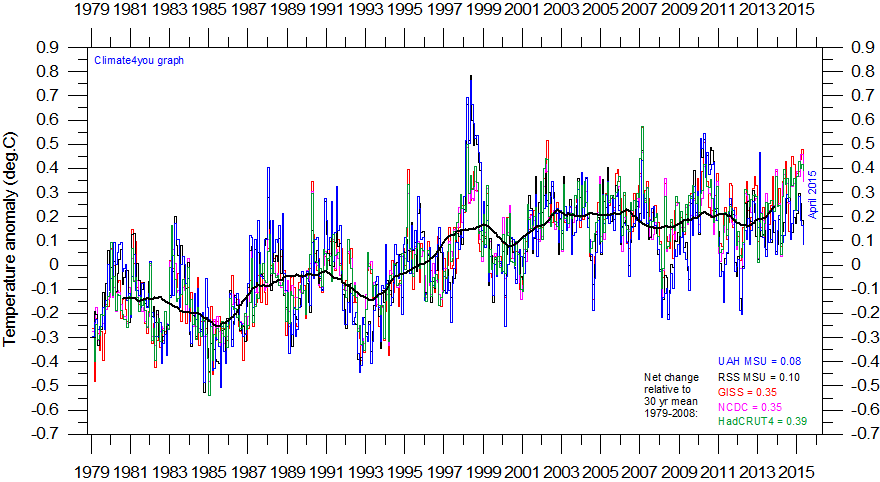
Shows that you can pick and choose your data to show whatever you want. Only when taking all of the available data does a clear picture emerge. And for that clear picture to emerge, you also need a good understanding of the natural climate variability, which you clearly don't, otherwise you would not have shown those graphs to begin with.
Shows that you can pick and choose your data to show whatever you want. Only when taking all of the available data does a clear picture emerge.
And for that clear picture to emerge, you also need a good understanding of the natural climate variability, which you clearly don't, otherwise you would not have shown those graphs to begin with.

Hopefully we get some of that Vortex. While the weather today is quite pleasant, the last week or so in New England has sucked.
Guess Al Gore is wrong.....
Al Gore... seriously... You guys are not doing yourself any favour when you use Al Gore to try to make a point.
BG: all of the scientists I know that deal with climate change are going to be happy if is happens slower than expected.
Jack 97: Please don't talk about acedemia and job security, something you clearly know nothing about first hand.
To your stupid graph above I'll counter with this since you have shown incapable of discussing real science:
http://www.slate.com/blogs/bad_astr...of_arctic_ice_recovering_are_exaggerated.html


Guess Al Gore is wrong.....


BG: all of the scientists I know that deal with climate change are going to be happy if is happens slower than expected.
I'm not talking in absolutes. Not "everyone", but there is definitely an almost "anger" or aggravated state among many people in that crowd when you get enormously positive data that runs counter to the sky-is-falling, for which they should be happy, not mad.
What about these graphs? I see a lot of pauses in the temperature anomaly, NH sea ice anomaly and ocean heat content.


The only place where AGW is occurring is in the computer models, the only way to stop this warming is to stop the simulations.